I have spent countless hours this year listening to conference presentations and webinars about the utility of the future, with wise heads from every sector of the industry discussing what changes are coming, when they will arrive and what it all means. The talks have been interesting, if not a bit predictable, but they have all missed a central point: No matter how smart the forecaster or how thoughtful the analysis, unforeseen technologies or unexpected events are certain to render them essentially meaningless.
Think that is too harsh an assessment? Well, then, take a tour with me of the Energy Information Administration’s 2004 (yes, I said 2004) Annual Energy Outlook. Before we begin, let me offer a quick caveat: I am a big fan of EIA and its data collection and interpretation work since it is not tied to any side of the debate. This impartiality is vital; you can quibble with the numbers, but at least you don’t have to worry that they are skewed because of who was footing the bill.
Trust me, I don’t normally peruse back issues of EIA’s outlook, but I pulled it up for some other research and the more I read, the more intrigued I became. And as I read, I couldn’t get over the feeling that while the analysis was just 10 years old, it seemed to be talking about a different world than the one we live in today.
Natural Gas Turnaround
Let’s start with this: “The most significant change made in the AEO2004 energy supply projections is in the outlook for natural gas,” EIA wrote. “Domestic natural gas production increases from 19.1 trillion cubic feet in 2002 to 24.1 trillion cubic feet in 2025 in the AEO2004 forecast, an average increase of 1.0 percent per year.”
According to current EIA data, actual U.S. domestic natural gas production topped 24.3 tcf in 2013.
So what happened?
The Marcellus Shale play is what happened. Starting from zero—the first well tapping into this resource, which stretches from New York southwest through Pennsylvania and into West Virginia and Ohio, was drilled, coincidentally enough, in 2004—production from the play has soared in the past 10 years. Now, operators in the Marcellus region are pumping out more than 15 billion cubic feet of gas every day—roughly 5.5 tcf annually. And the upward trend shows no sign of tapering off, at least not yet.
Move a bit to the west and a similar development is playing out in the Utica Shale region in Ohio. While not as large as the Marcellus, production from Utica has soared from just 200 million cubic feet a day at the beginning of 2013 to almost 1.4 billion cubic feet a day in mid-2014.
Neither the Marcellus nor the Utica shale plays are even mentioned in EIA’s 278-page 2004 report. To get a great sense of the impact of this error, take a close look at the two graphics below, paying particular attention to their estimates of gas shale resources.
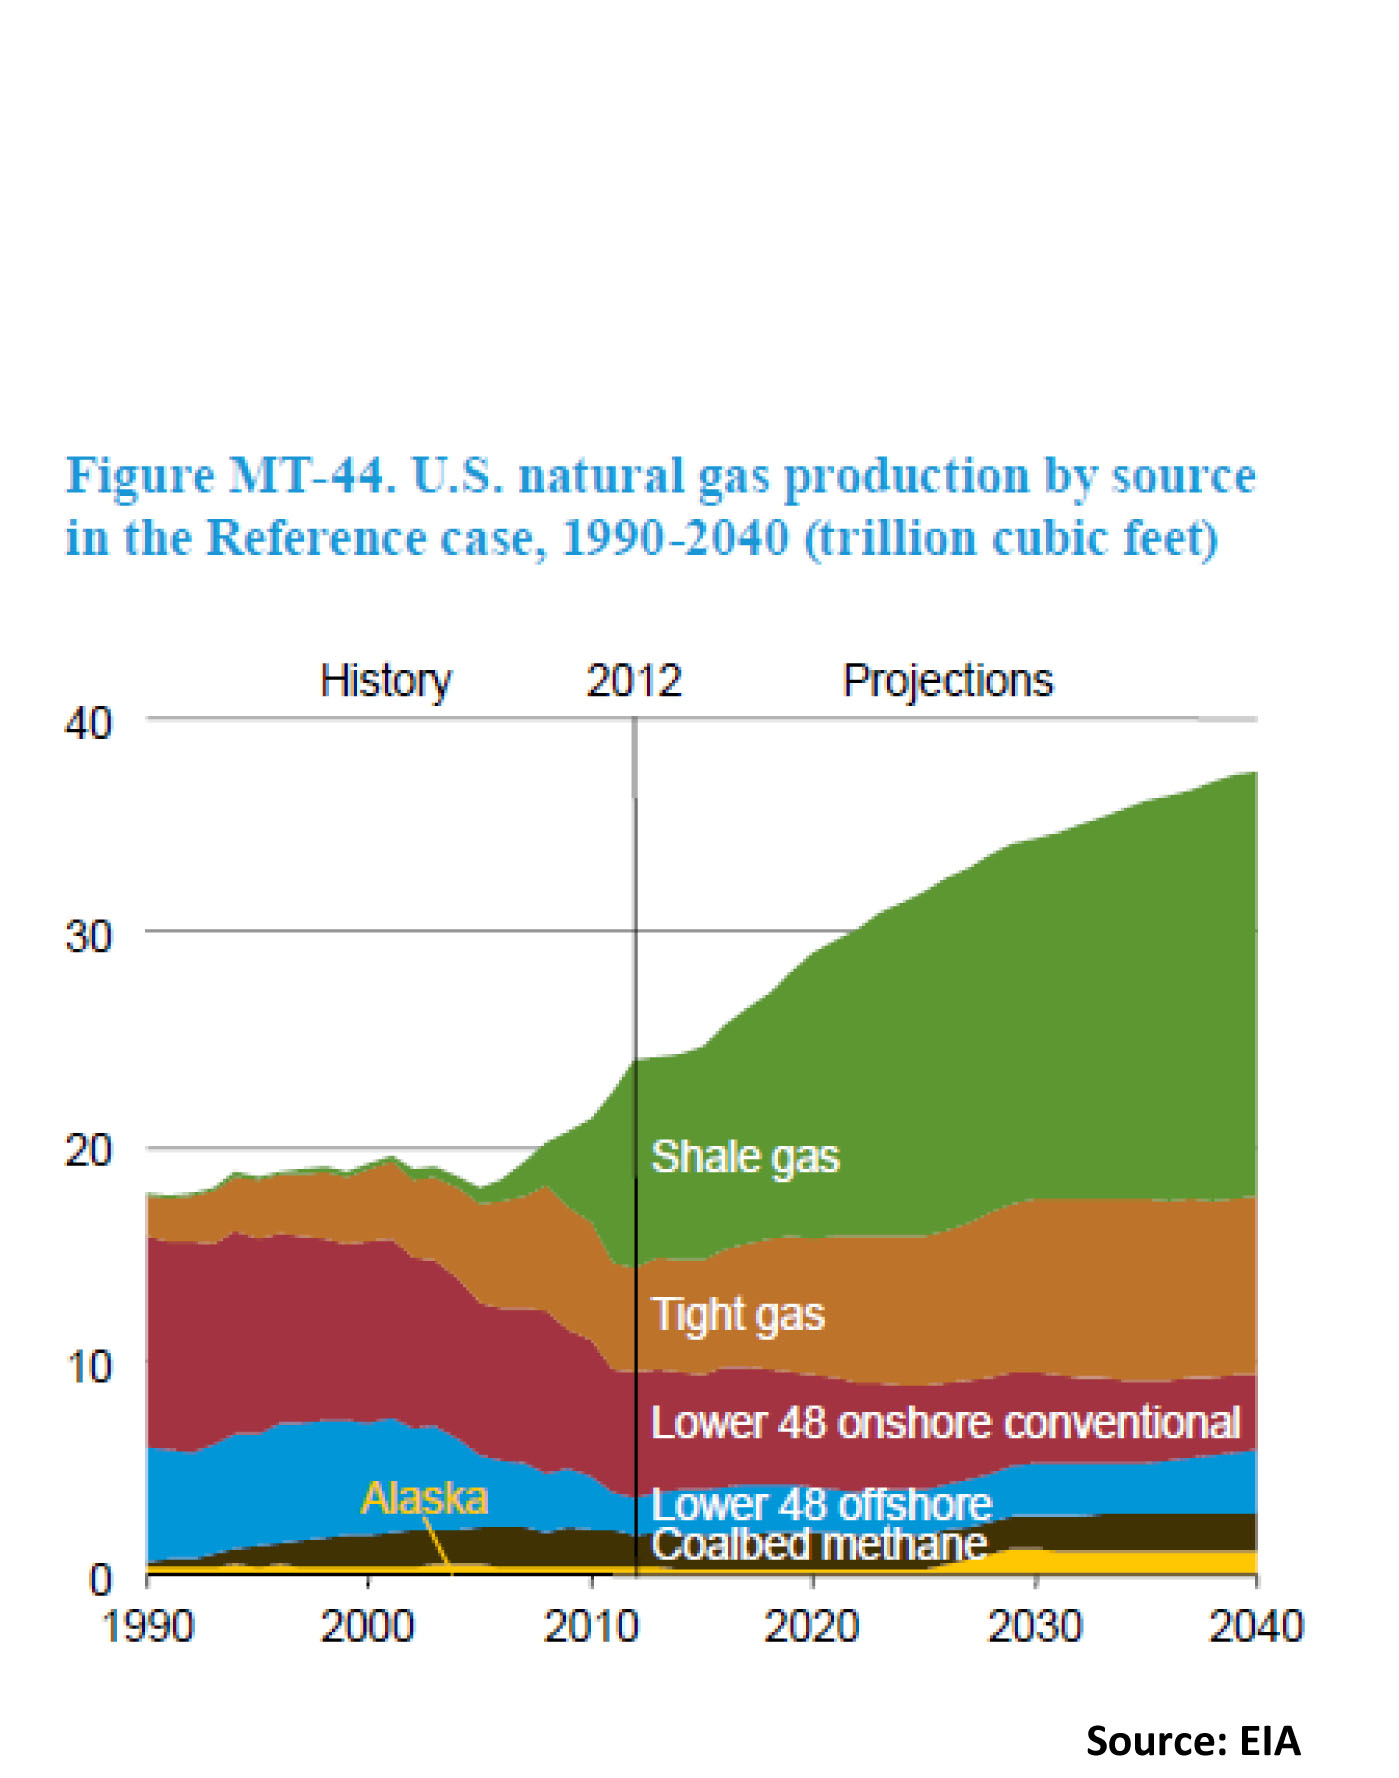
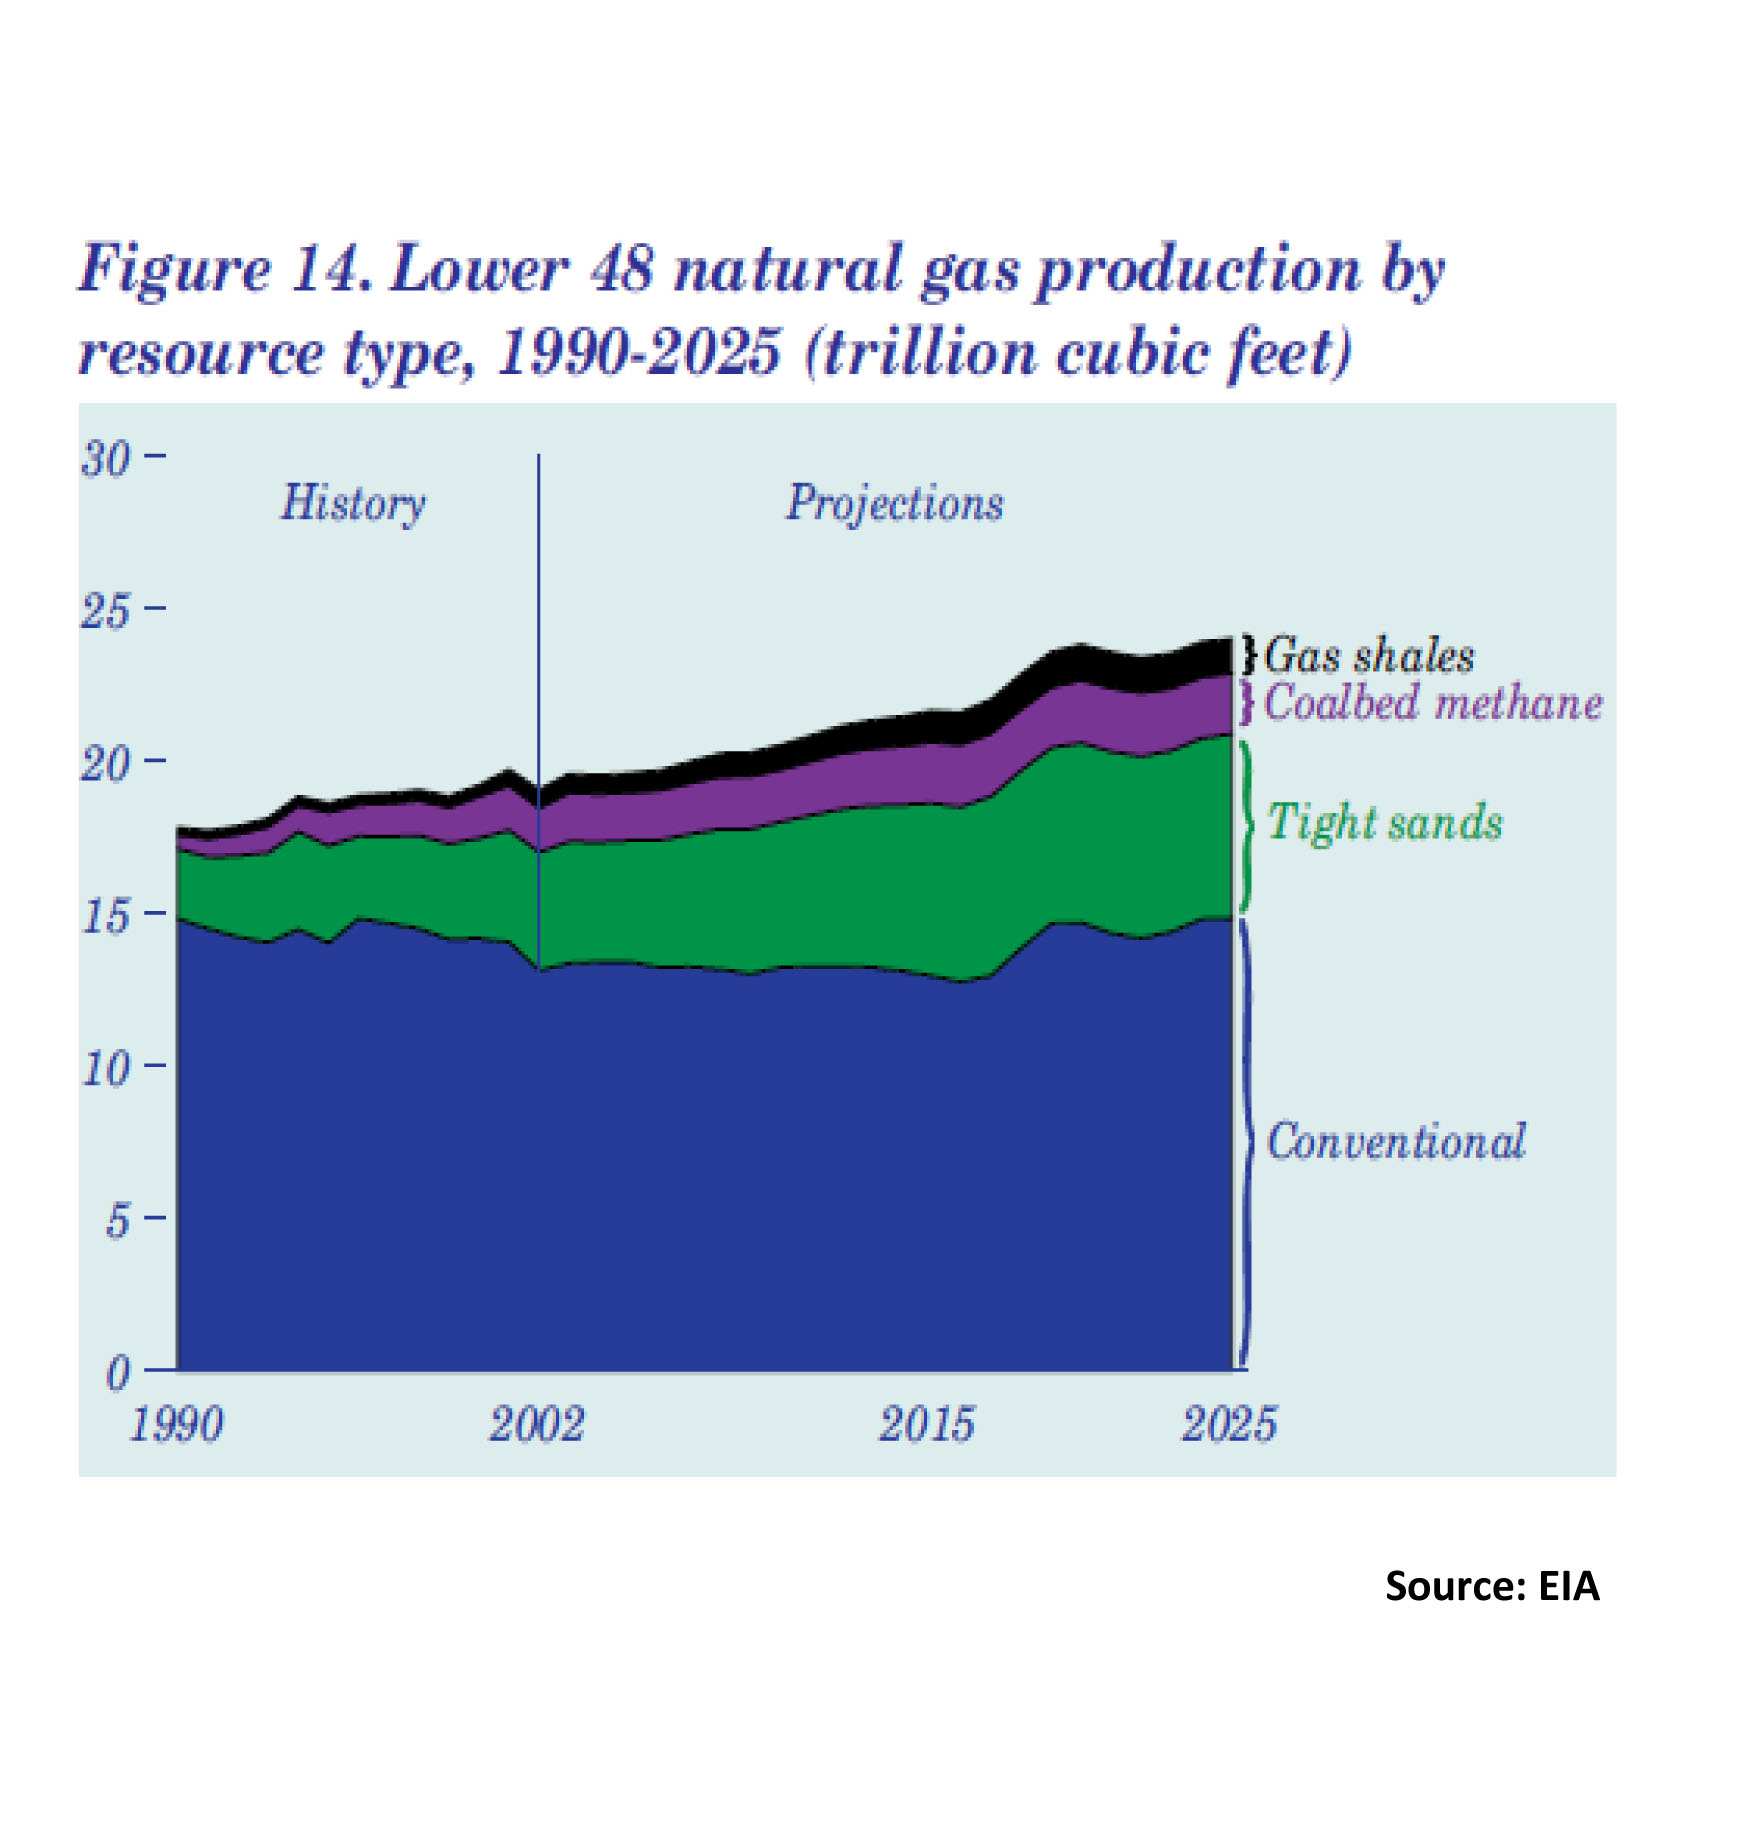
The resources were known, in fact there are records of shale gas wells being drilled in Erie County in the northwestern corner of Pennsylvania dating back to 1860. But tapping into the resource wasn’t easy and development stalled until horizontal drilling and hydraulic fracturing technologies were commercialized in the 1980s and 1990s. Initially used for oil production, these techniques were ultimately adapted for use in natural gas extraction, and the rest, as the saying goes, is history. Now, shale gas accounts for more than 40 percent of annual U.S. production, with increases expected to continue into the future.
Missing this resource had predictable ripple effects throughout EIA’s 2004 Outlook. In particular, the agency predicted that coal’s share of the electric generation market would climb from 50 percent in 2002 to 52 percent in 2025, while it estimated that natural gas’ share would remain stuck at around 20 percent. The reality is coal’s share of the electric market fell below 50 percent in 2005 and has dropped gradually since; current forecasts have coal’s share of the market falling below 40 percent by 2025.
The missed domestic resource also skewed EIA’s outlook on LNG. At the time, it forecast a sharp rise in LNG imports to help meet rising domestic natural gas demand, with the U.S. expected to be bringing in almost 5 tcf annually by 2025. The reality is that imports essentially dropped to zero in 2013 (well 93 billion cubic feet actually) and companies are lining up to gain federal approval to export LNG.
Oil, Oil, Everywhere
But natural gas wasn’t the only miss in EIA’s 2004 report; the agency also erred badly on oil production expectations, and here too unexpected technology developments played a major role.
In its Outlook, EIA forecast that U.S. crude production would peak at 6.1 million barrels of oil per day (mb/d) in 2008 and then begin a long, steady decline. Combined with rising demand, this pushed EIA to expect steadily rising levels of imports: By 2025 net petroleum imports (both crude and products) were pegged to hit 70 percent of annual U.S. demand.
It hasn’t turned out quite the way EIA expected. Far from peaking at 6.1 mb/d, U.S. crude production hit 7.4 mb/d in 2013 and has averaged more than 8.3 mb/d so far this year. Production has increased essentially across the board, particularly in Texas, but the use of horizontal drilling and hydraulic fracturing has also opened up resources that essentially weren’t available in 2004—notably North Dakota’s booming Bakken Shale oil shale play. As recently as 2008, production there was well under 200,000 barrels/day; today, the region is producing more than 1.2 mb/d.
Renewable Revolution
EIA also badly missed the mark on the spread of renewable energy over the past decade, particularly concerning wind and solar. Overall, the agency projected that renewable generation would climb from 339 billion kilowatt-hours in 2002 to 518 billion kilowatt-hours (kwh) in 2025. Well, we got there a little early: Driven by a huge increase in windpower generation, total renewable electricity generation actually topped 522 billion kwh in 2013.
The agency can be forgiven for part of this error since its forecasts do not assume incentives will be extended if they contain expiration dates past the publication of a given forecast. Consequently, its 2004 Outlook did not include the extension of the federal production tax credit that has boosted windpower over the past decade. Still, the disparity is glaring: EIA forecast then that installed windpower generation would not hit 16 gigawatts until 2025; the reality is that more than 62 GW of windpower is currently installed, supplying more than 4 percent of the nation’s electricity supply.
Turning to solar, EIA was similarly off the mark. “Solar technologies are not expected to make significant contributions to U.S. grid-connected electricity supply through 2025,’’ the agency wrote, projecting that solar would not even generate 5 billion kwh in 2025. According to current EIA statistics, solar output topped 8 billion kwh in 2013.
To its defense, EIA had no way of forecasting the sharp drop in solar module prices that has occurred over the past 10 years, nor any ability to project the subsequent surge in interest from commercial and residential customers in installing their own PV units. But that is precisely the point: What are we missing today that will turn the industry upside down 10 years from now?
Anybody have a Ouija board?
–Dennis Wamsted
 Follow
One thought on “A Sober Look
At Energy Forecasts”