Good news can be hard to come by in the electric utility industry these days—overall growth is stagnant, new technologies and competitors are aching to get into the market, and customers are beginning to act like, get this, customers, seeking something more than just a monthly bill from their provider. So a report showing soaring growth anywhere in the sector should be a cause for celebration—except, of course, when it includes its own version of a self-destruct mechanism.
The report in question is EIA’s recently released commercial buildings energy consumption survey (CBECS), a treasure trove of data, somewhat dated to be sure, but compelling all the same. The occasional report—it has been released nine times since 1979—estimates that electricity use in commercial buildings totaled 4,241 trillion Btu in 2012 and accounts for more than 60 percent of the sector’s total energy consumption. While EIA touts the fact that electricity consumption in commercial buildings has almost doubled since it began tracking usage in 1979, the real newsworthy growth has occurred since 1995. Since then, consumption of electricity in commercial buildings has risen by roughly 50 percent, from around 2,750 trillion Btu to 2012’s 4,200-plus level. That 50 percent-plus rise in 17 years amounts to more than 3 percent annually—a level of demand growth that would thrill today’s growth-starved utility executives.
But there is a catch, which I’ll get to in a minute.
First, the good news, and a bit of explanation.
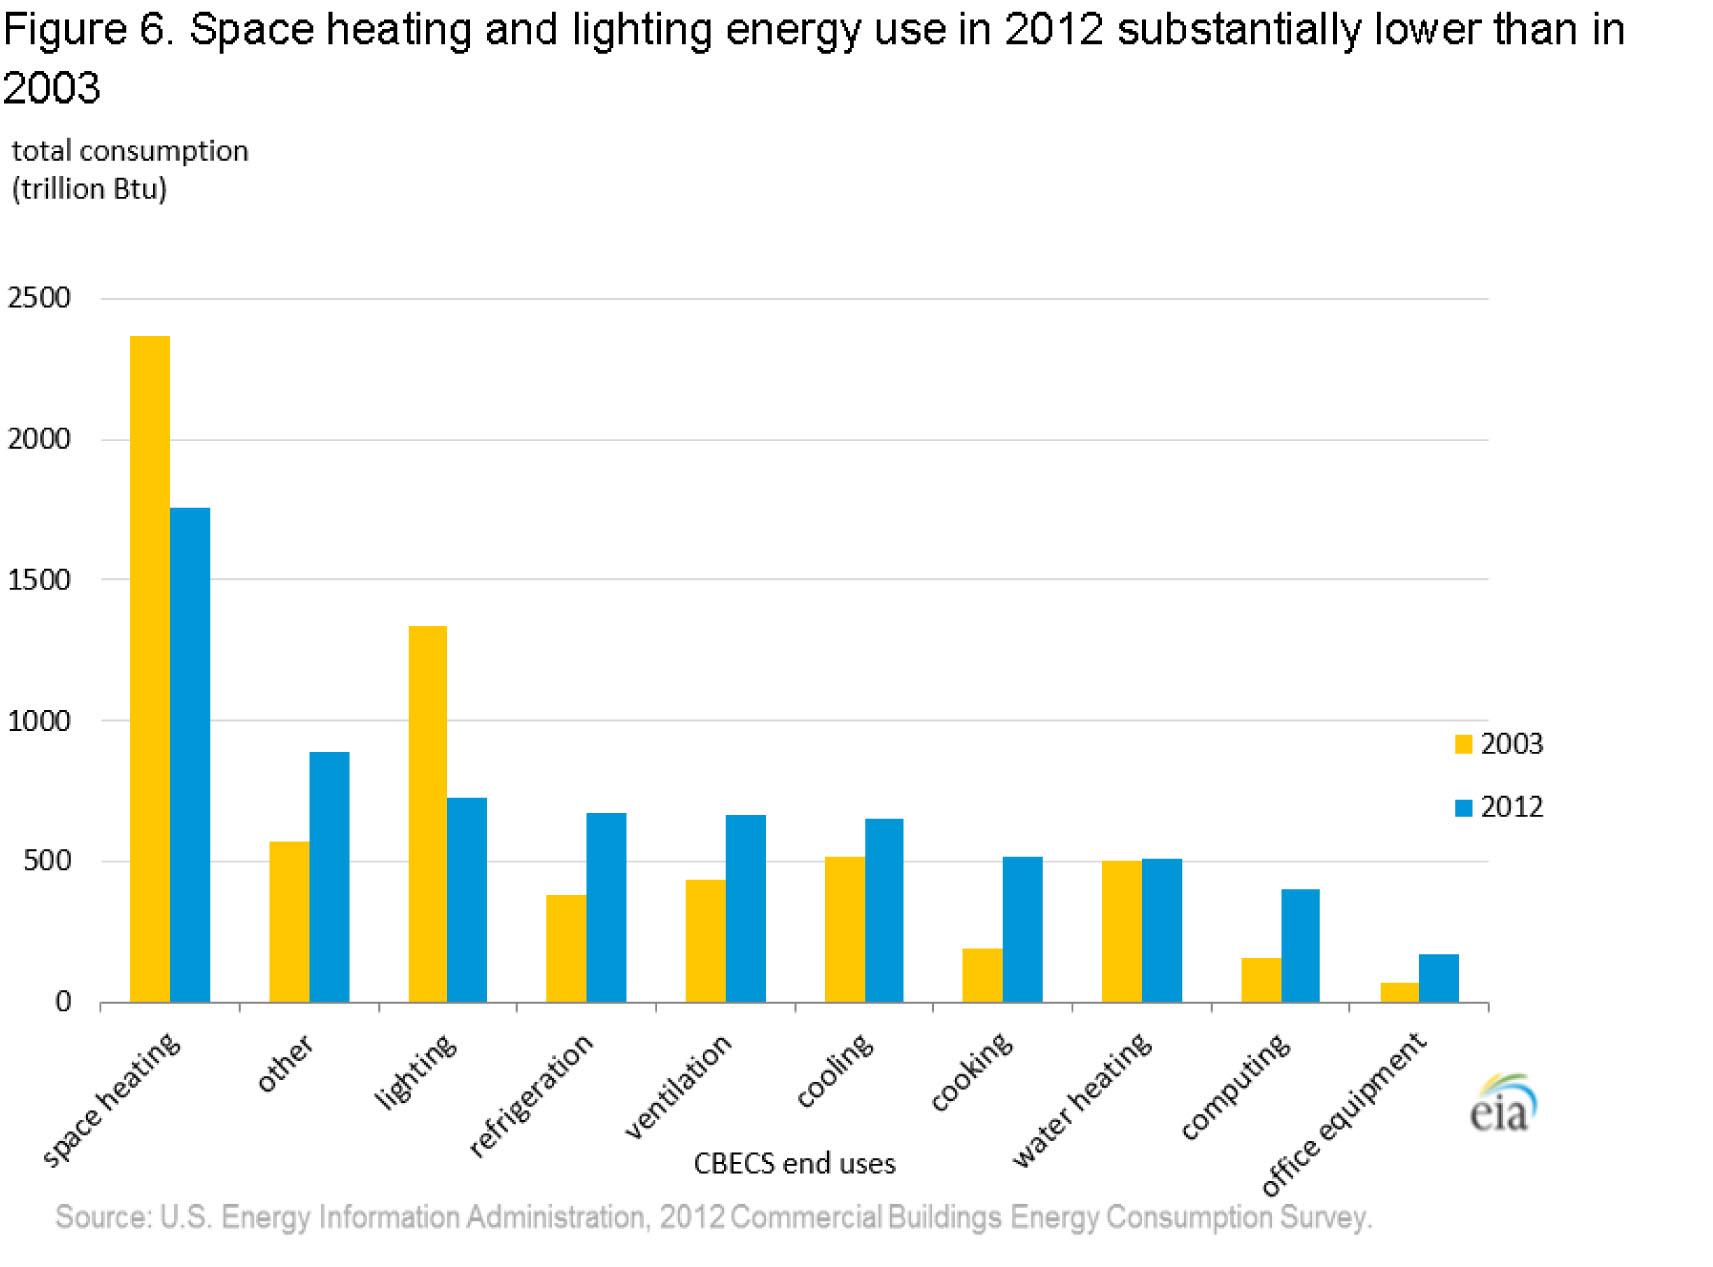
EIA breaks energy consumption in the sector down into 10 categories—space heating, cooling, ventilation, water heating, lighting, cooking, refrigeration, office equipment, computers and other (which includes motors, pumps, air compressors, process equipment, backup electricity generation, and miscellaneous appliances and plug-load). Electricity is the prime mover in seven of these categories, with natural gas being the principal fuel for space heating, water heating and cooking. And in the electricity-driven categories, growth has been robust since the last survey was released in 2003 (with that one catch noted above):
- Cooling demand, up 31.6 percent, to 633 trillion Btu;
- Ventilation, up 53.2 percent, to 668 trillion Btu;
- Refrigeration, up 75.9 percent, to 670 trillion Btu;
- Other, up 84 percent, to 769 trillion Btu;
- Office equipment, up 149.3 percent, to 172 trillion Btu; and
- Computers, up 159.6 percent, to 405 trillion Btu.
That’s growth worth crowing about—except for the not-so-tiny issue of lighting. Commercial electric demand for lighting applications, by far the single largest demand segment in 2003, tumbled 46 percent in the intervening nine years, to 724 trillion Btu from 1,340 trillion Btu. EIA attributes the decline largely “to the increasing use of compact fluorescent and LED bulbs as replacements for lower efficiency incandescent bulbs.”
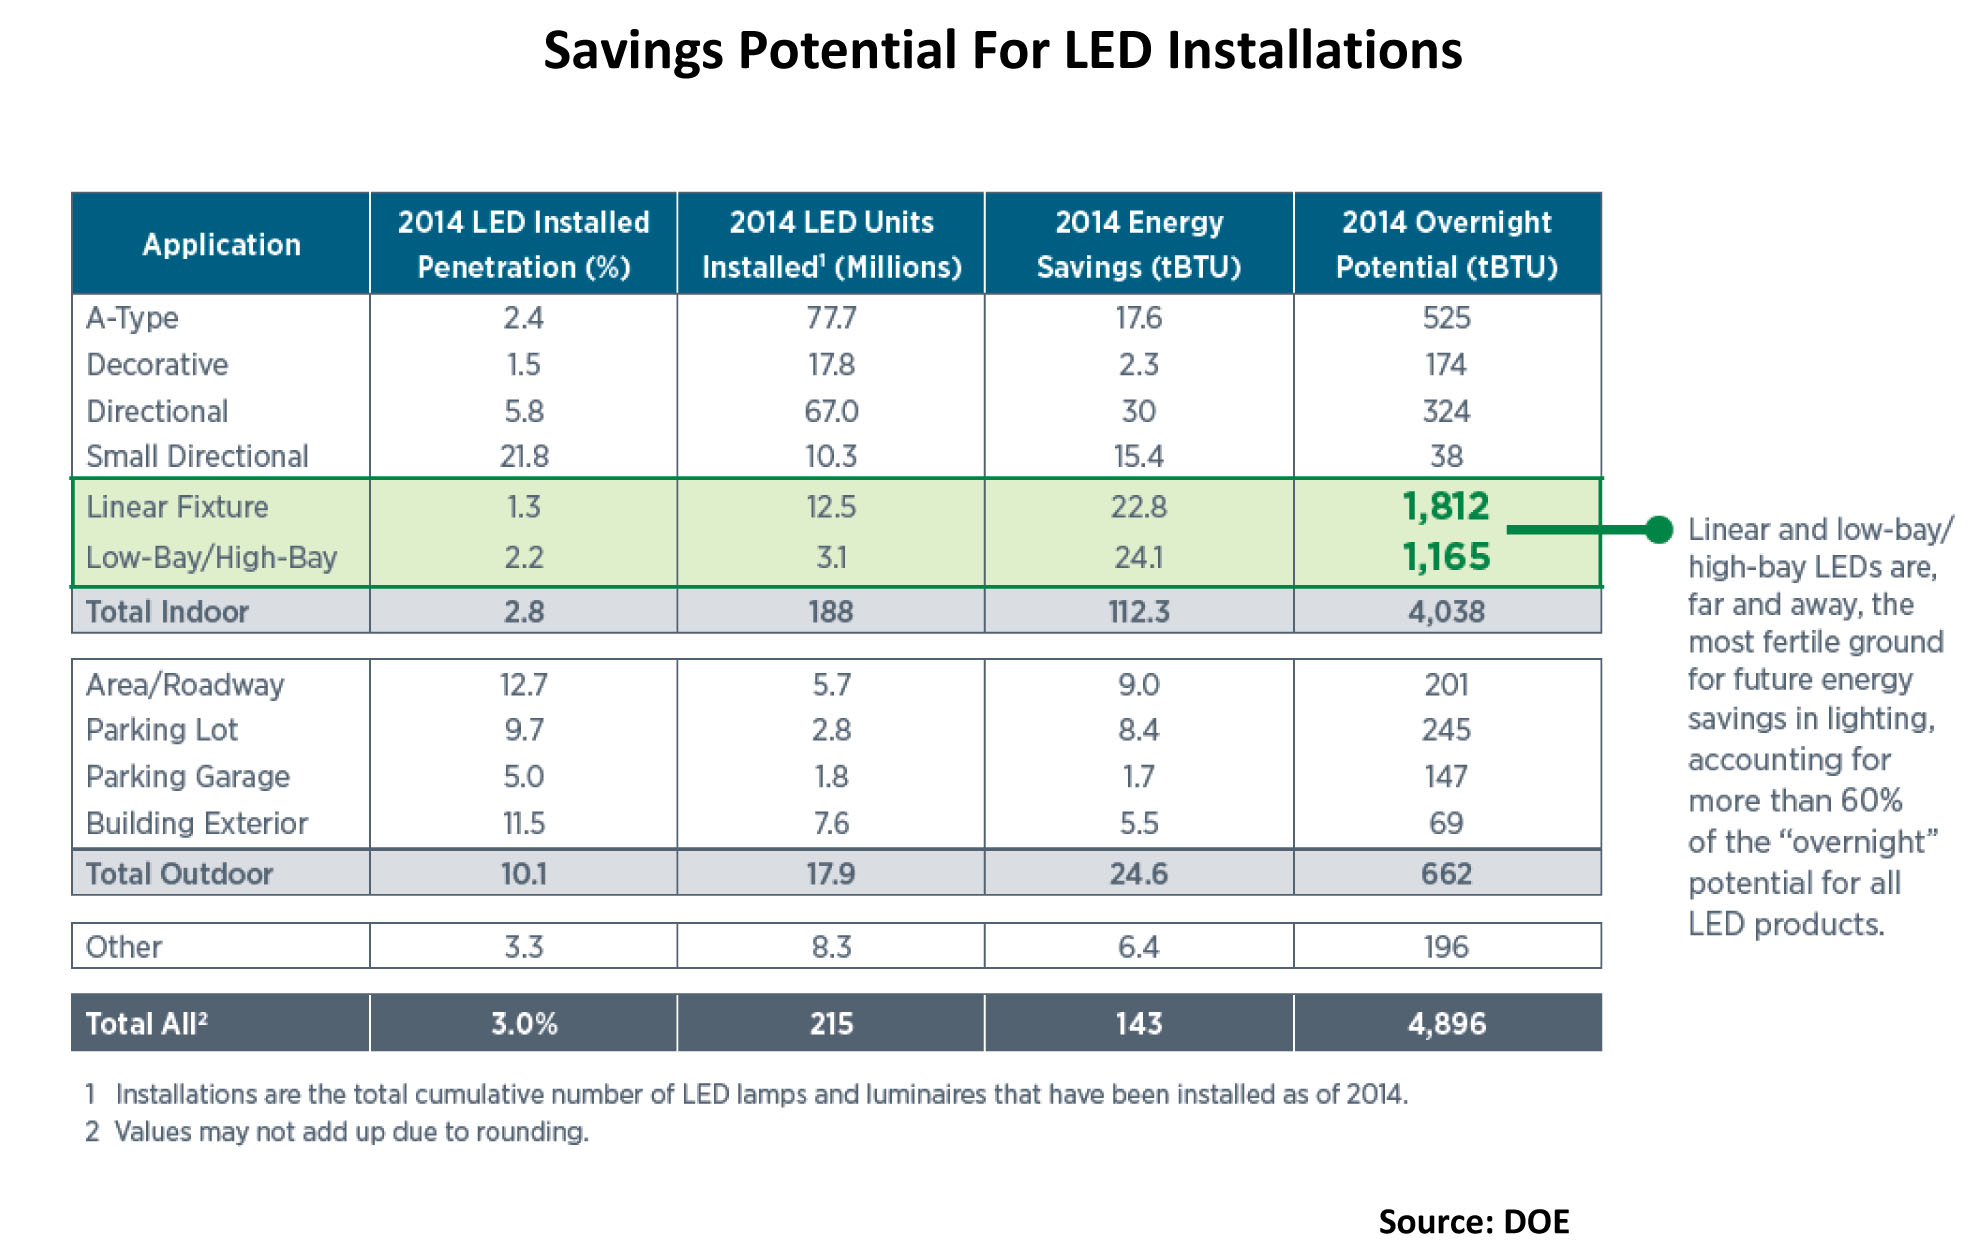
True in part, but that sentence misses a major point: Commercial purchases of LED replacements had barely registered on the lighting sector radar screen in 2012. For example, in its 2015 review of the market for DOE (the full report can be found here), Navigant Research reported that total sales of LED luminaires in 2012 for the commercial troffer market (the recessed fluorescent lighting units we are all so familiar with) totaled just 700,000—less than 1 percent of the total market. Sales soared through 2014, jumping to 9.8 million, but even that barely pushed LEDs to slightly more than 1 percent of the overall market.
The same story holds true for what is called the low/high bay commercial lighting sector (essentially the lighting used in big box stores, warehouses and similar operations). In 2012, sales of such LED fixtures totaled just 400,000 units, less than 1 percent of the market. By 2014, Navigant said, sales had jumped to 3.1 million, accounting for about 2 percent of the market overall.
There is no reason to expect the price (downward) and efficiency (upward) trends in the LED market to slow anytime soon, meaning continued adoption of these growth-robbing lights is almost a certainty, What the lighting line-item will look like in EIA’s next commercial sector energy survey is anyone’s guess, but I’m betting the sharp downward trend will continue.
Another key point is the movement toward integrated building energy management made possible by sensor-equipped LEDs. These systems are being installed today; how much they will cut into buildings’ ventilation and cooling needs remains to be seen, but it is not likely the percentage increases from 2003-2012 will be replicated the next time EIA releases its commercial energy consumption survey.
In other words, utility executives would be wise to temper their enthusiasm about the good news in this EIA survey—it likely will be short-lived.
–Dennis Wamsted
[To check out all of EIA’s commercial sector energy consumption data, which show the sector using a total of just under 7 trillion Btus of energy in 2012, up about 7 percent from 2003, click here). In addition to the consumption data, there is great background information on the size, ages and uses of the existing commercial sector building fleet (some 5.6 million buildings with 87 billion square feet of floor space, up 14 percent and 22 percent, respectively, since 2003) as well as a good explanation of how EIA collected the information and why it all takes so long (as part of its data collection process, for example, the agency conducted more than 6,700 onsite interviews around the U.S.).]
 Follow
I would point out that the drop in space heating should really worry the industry, because it comes at the same time as people have been switching *from* fuel heating *to* electric heating. This means that the buildings are much more efficient than they used to be….