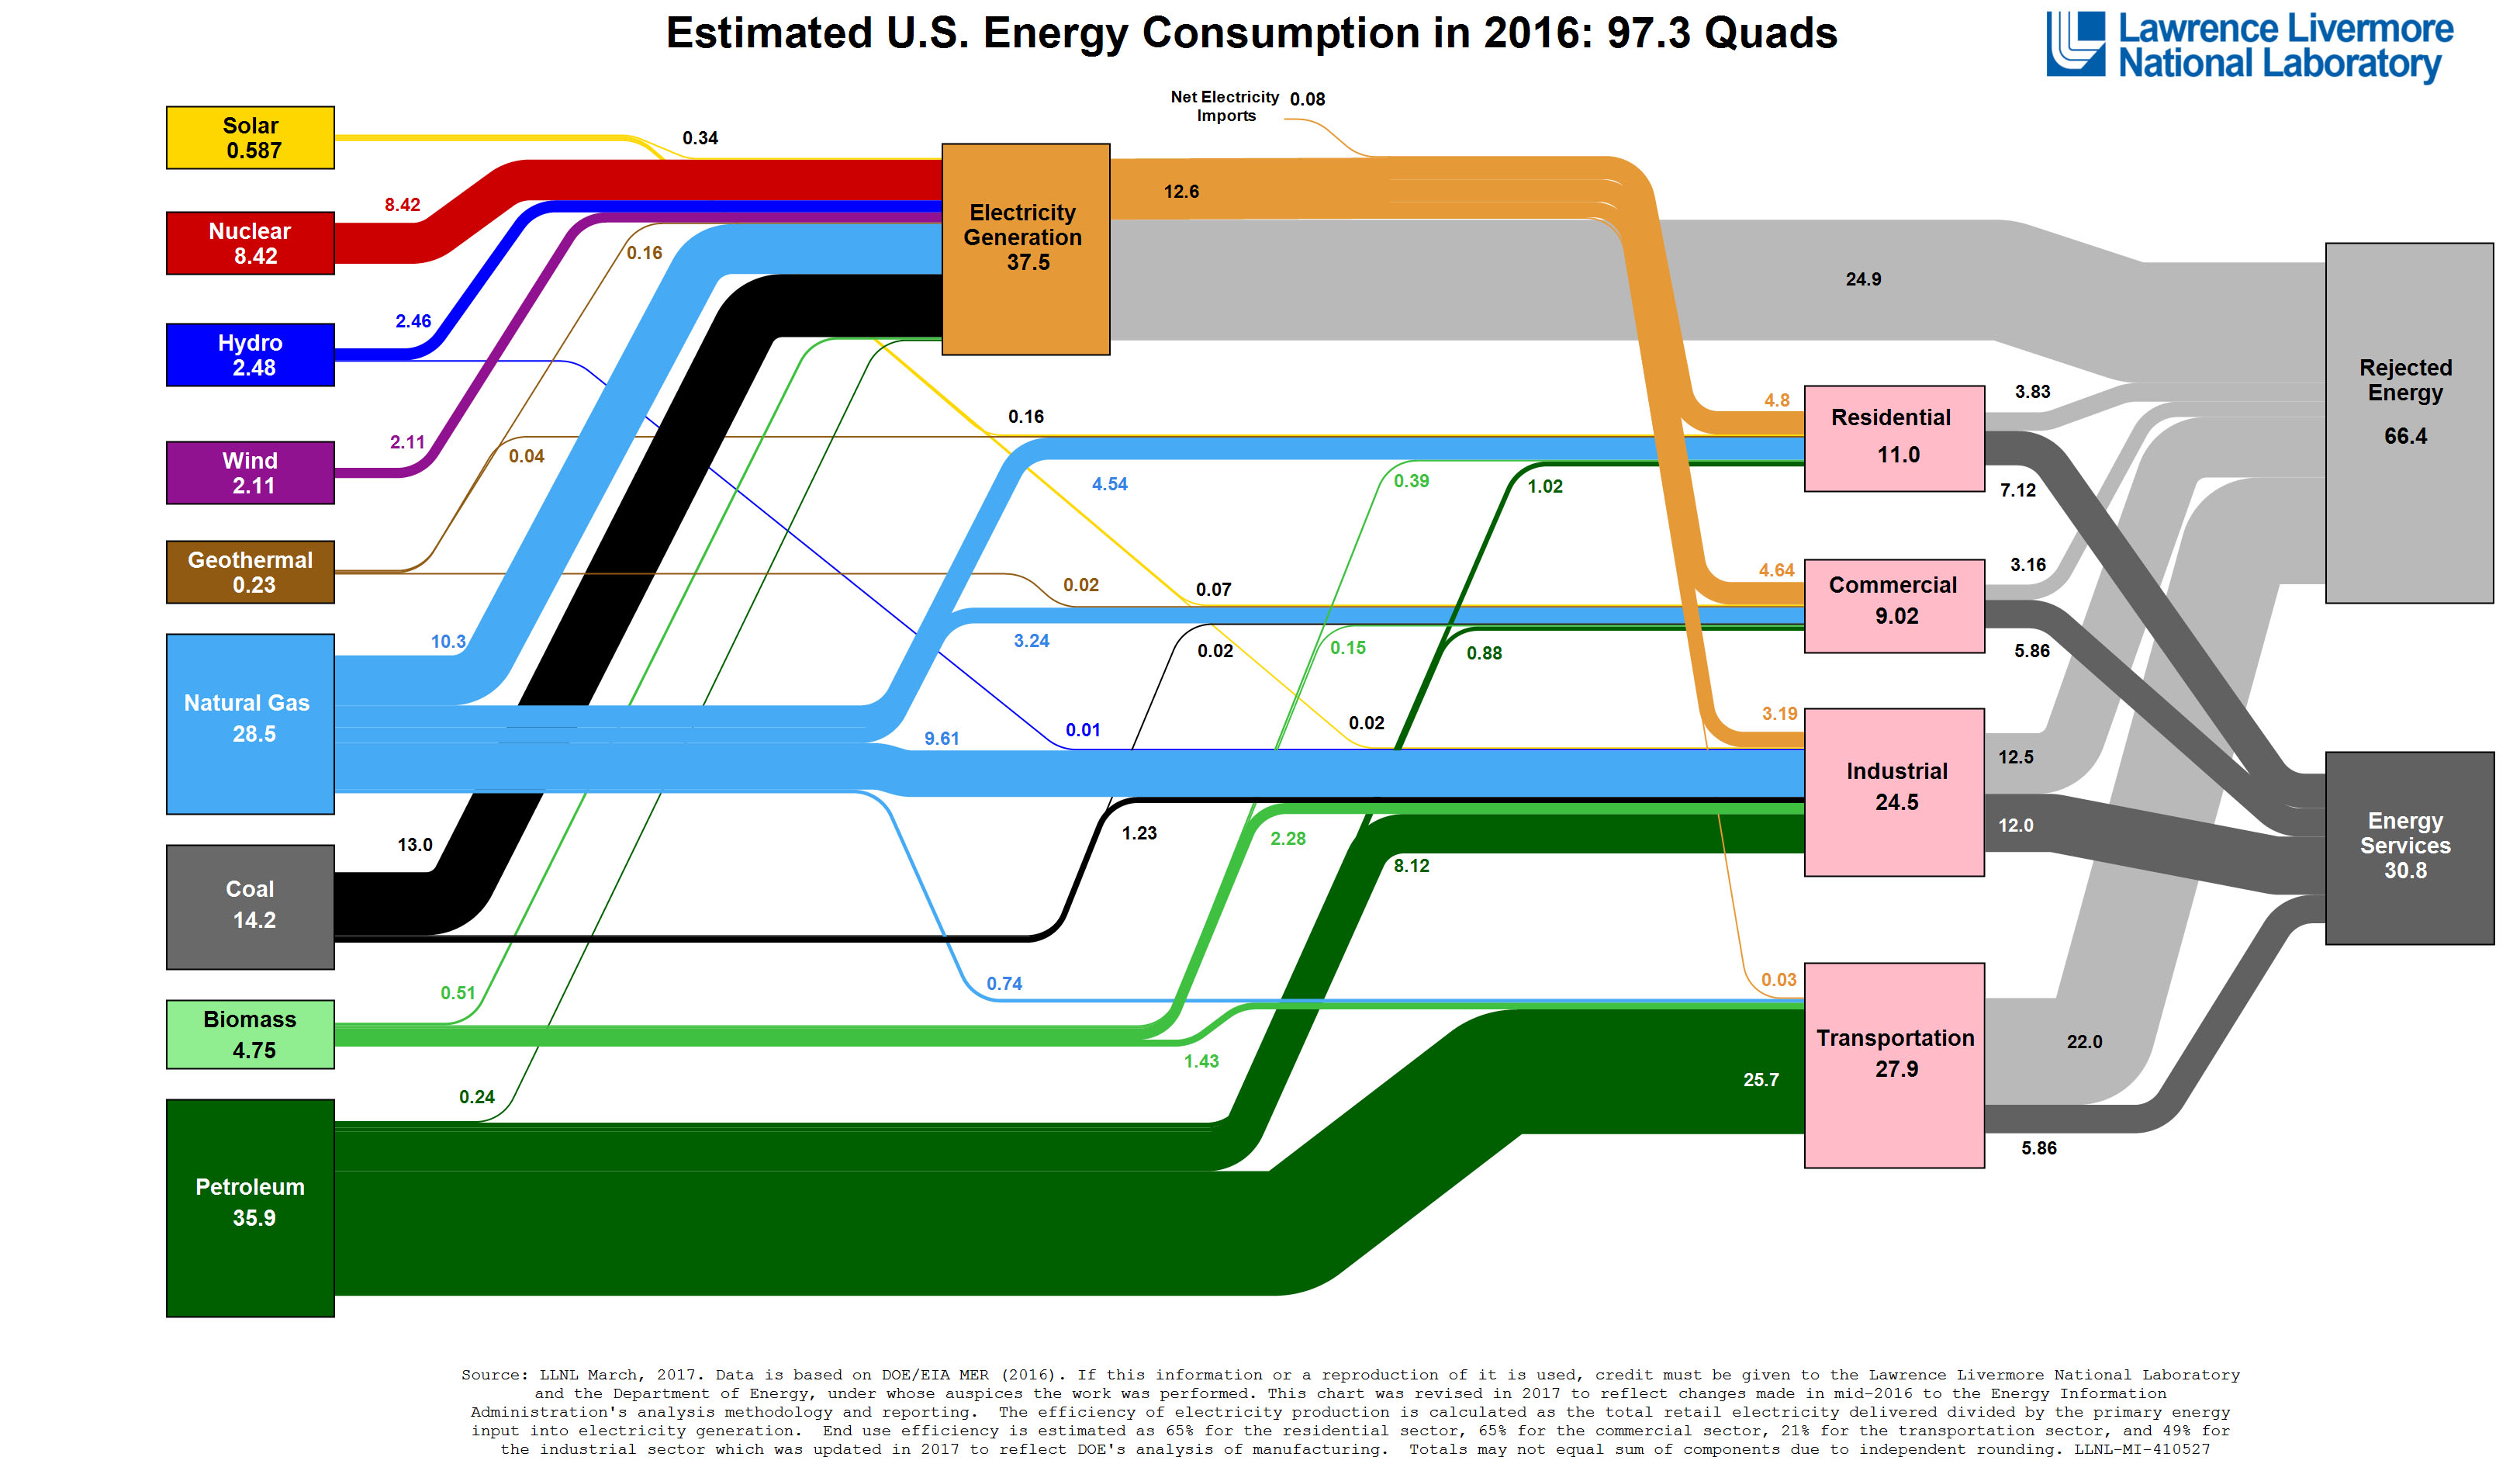
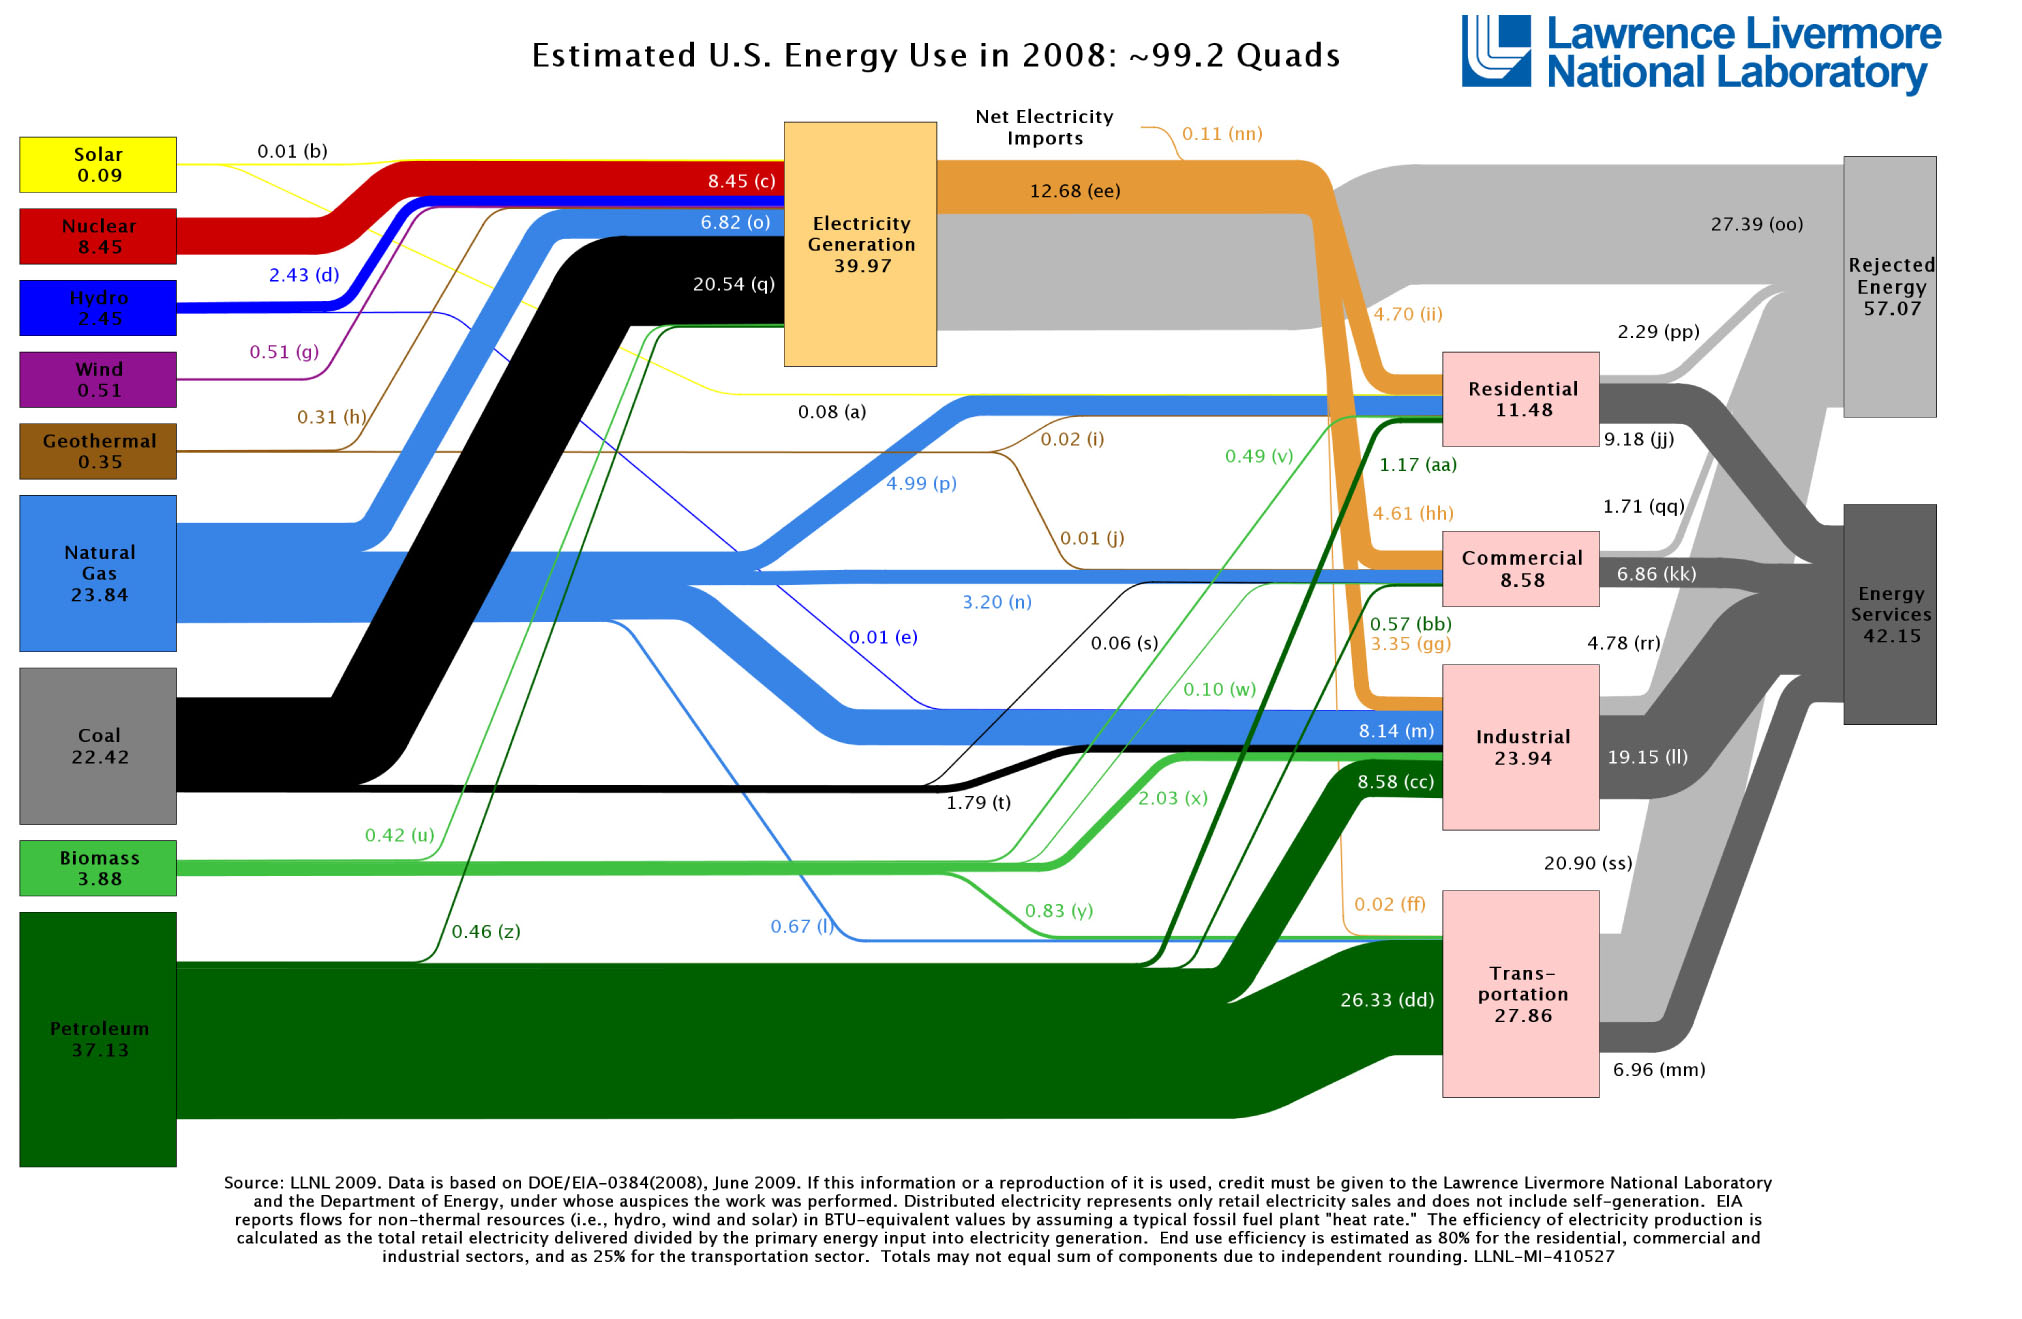
I have always loved this chart, which at a macro level tells you almost all you need to know about U.S. energy consumption. The lab has been doing this same chart for years; below you will find the latest version, which includes numbers for 2016, and the 2008 chart. Look carefully (you can enlarge the charts by clicking on them) and you can see that much has changed. Particularly notable is that overall consumption was just 97.3 quads in 2016, 1.9 quads below the 2008 level even though the economy is much larger today than it was eight years ago. If you would like to download the charts yourself, as well as explore a bunch of other state-specific information, go here.
To return to the main page, click here.
 Follow