Republican rhetoric about the Obama administration’s alleged ‘war on coal’ has been heated, and frequently repeated over the past eight years—but it’s wrong. The only war against coal is being waged by market forces, in the form of plentiful and cheap natural gas, low or stagnant electric demand growth, cleaner and ever-cheaper solar and wind, and finally being forced to pay the bill for years of environmental neglect. And the market forces—those same brutally efficient and unemotional market forces that Republicans so cherish in the abstract—are winning.
The Energy Information Administration reported earlier this month that more than 80 percent of the almost 18,000 megawatts of generating capacity retired in 2015 was coal-fired. At first blush (and certainly for the conspiracy-minded) that sounds implausible. But a closer look at the numbers reveals a much different story.
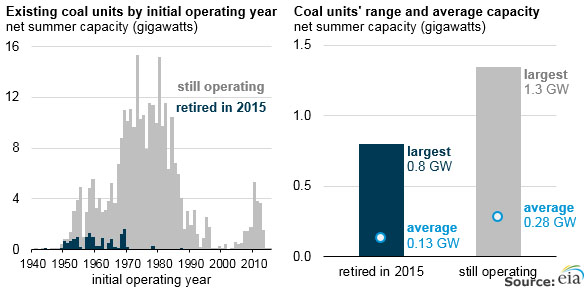
All told, 94 coal-fired units were retired in 2015, and as a group they were much smaller and older than the rest of the coal fleet. Specifically, EIA says the average age of the units retired in 2015 was 54, compared to 38 years for the plants still in operation. Similarly, the retired plants had an average net summer capacity of 133 MW, compared to 278 MW for the remaining coal fleet.
The EIA graphic below does a great job of visualizing the disparity between the two classes of plants.
Even more telling in my book is the plants’ capacity factor. Overall, EIA says the nation’s coal plants posted a capacity factor of 55 percent in 2015, but the numbers for the retired 94 were radically worse. Individual plant capacity factors can’t be pulled directly from any EIA report that I know of, but they can be calculated from the volumes of data collected by the statistics group every year, and when you do that an interesting picture emerges. [I explain where the data came from and how it was calculated in a note below; the spreadsheet is also attached for the data driven to play with.]
Skipping 2015 itself, since the capacity factors for the retired/retiring places obviously would be negatively affected that year, let’s focus instead on 2013 and 2014. During those two years, the class of 2015’s 94 plants posted an average capacity factor of 26 percent (2013) and 28.6 percent (2014)—well below the fleet average those two years of 60 percent and 61 percent, respectively.
Breaking the numbers down even further, the data show that 42 of the units (44 percent of the total) had a capacity factor of 15 percent or lower in 2013, while 44 plants (46 percent of the total) posted similar results in 2014. Perhaps most telling, 19 units had a capacity factor of 0.0 percent (or lower) in 2013 and 25 units posted similarly poor numbers in 2014. (Just as an FYI, EIA presents its data as “net of station service,” meaning that if a plant is using power, but not sending electricity to the grid it will have a negative capacity factor.)
Clearly, these plants weren’t pushed into retirement by some political vendetta, they were retired for solid economic reasons—they could no longer perform.
And economic reason number one is the revolution that has occurred in the natural gas industry in the past decade. Driven by fracking, natural gas supplies have surged in the past 10 years and prices have tumbled, leading to a sharp upward swing in natural gas’ share of the electric generation market.
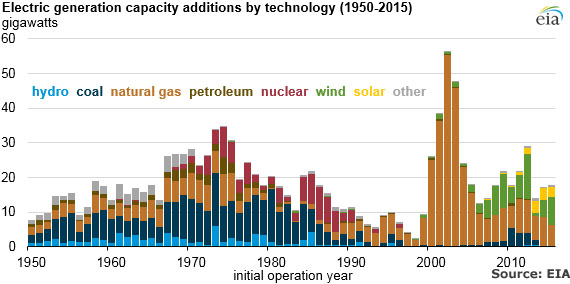
The capacity has been in place since the early 2000s natural gas capacity building boom, when more than 180 gigawatts of new natural gas fired generation (see chart below) was built in the five-year period from 2000-2004.
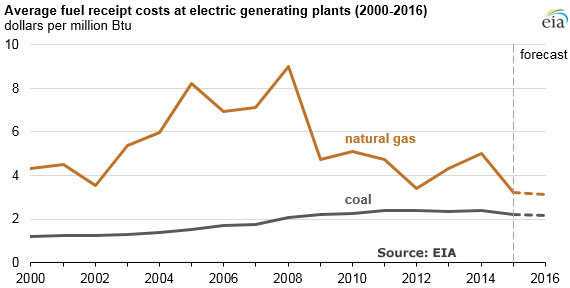
But gas’ higher prices largely kept it on the sidelines, and through 2008 coal continued to account for roughly 50 percent of the nation’s annual electricity supply. That began to change in 2009, and since then the price gap between the two fuels has narrowed significantly.
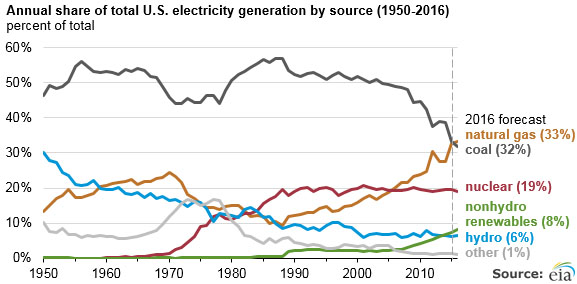
Not surprisingly, as natural gas prices have fallen, the fuel’s share of electricity generation has risen—so much so that EIA recently predicted that natural gas’ share of annual electricity supply would top coal’s in 2016 for the first time.
Ignoring these basic Econ. 101 developments, the administration’s critics have focused closely on the negative impact of the EPA’s recent string of coal-related environmental regulations, particularly the 2011 mercury and air toxics standards that went into effect April 2015. And here too, at first glance it appears that the critics might have a point; for example, EIA noted recently that 30 percent of the coal plants that retired in 2015 did so in April when the new MATS rule took effect.
But dig a little deeper and the critics’ arguments fall apart here too. For starters, it is not like the MATS rule took anybody by surprise—EPA was first directed to review the issue in the 1990 Clean Air Act Amendments for goodness sake. Then following a lengthy study, EPA reported in 2000 that coal-related mercury and other air toxics emissions needed to be regulated, and began drafting rules to do precisely that. In other words, the utility industry knew these regulations were coming and had plenty of time to plan for them.
In addition, technologies to reduce mercury emissions are widely available, and often overlap with other pollutants. For example, installing scrubbers for sulfur dioxide control, selective catalytic and selective non-catalytic reduction equipment for nitrogen oxides and fabric filters or electrostatic precipitators to cut particulate matter can also help cut mercury emissions. Further, the two other major sources of mercury emissions in the U.S.—municipal waste combustors and medical waste incinerators—have been subject to the same controls for years, and met them with little difficulty.
The real problem for the utilities wasn’t the rule itself, it was economics: With plentiful gas supplies and falling prices, retrofitting little-used, 50+-year-old coal-fired generating units with new environmental controls simply didn’t pass the cost benefit test. The sensible decision was simply to retire them and move on.
While this reality has escaped the administration’s critics, it is acknowledged (if a bit begrudgingly) by many of the affected employees. In an article on AEP’s web site (https://www.aep.com/environment/PlantRetirements/MuskingumRiver.aspx) about the May 2015 retirement of the five-unit Muskingum River plant, Nate Long, the facility’s manager since 2012, said: “Employees clearly understand units 1-4 have reached their end of life. But they were hopeful we would convert Unit 5 to natural gas. History shows Unit 5 to be one of the best units in AEP’s generation fleet. Unfortunately, the economics and future market projections do not support the conversion.
“It’s hard to put in to words what Muskingum River Plant has meant to so many over the last 61 years,” he added. “…Muskingum River Plant has been a source of safe, reliable power while maintaining a high level of environmental excellence. Now it’s time to move on.”
For the record, Units 1&2, both more than 60 years old, had not operated since 2012, and even that year the units’ capacity factor just barely topped 5 percent. Unit 3 operated at about 25 percent capacity, and Unit 4 at just over 10 percent. Time, indeed, to move on.
Another perspective was offered up by Rochester (Minn.) Public Utilities in its 2013 annual report: “As much as we are excited about the opportunities that CapX 2020 will offer us in terms of importing additional electricity into Rochester, we also continue down the bittersweet path of decommissioning the Silver Lake Plant (SLP), which has been an important source of electricity for Rochester for over 60 years.”
True enough, the plant did provide electricity to the city, famous for the Mayo Clinic, for a long time, but not so much recently. Indeed, since 2011 none of the plant’s four units has posted a capacity factor above 9 percent. Time to move on, once again—and save a little money to boot. According to the utility’s 2013 report, decommissioning the facility is expected to save $44 million through 2020.
MATS and other recent coal-related rules, such as the coal combustion residuals rule (for which the industry is directly responsible, search TVA Kingston 2008), undoubtedly have added to the cost of generating coal-fired electricity. But these are not gratuitous regulations; they are health and safety-based rules designed to bring coal-fired generation up to current standards. In essence, they constitute a leveling of the playing field, and that is a problem for coal.
Transitions are hard, that goes without saying, but in a market-oriented economy they are also inevitable—have you seen many buggy manufacturers since the rollout of Henry Ford’s Model T? And that certainly is what is under way now, a transition from a coal-mostly generation sector to a more diversified, cleaner portfolio. The only way for coal to continue to compete is to clean up its act while keeping its costs low; if it can’t do that it will be shunted to the sidelines.
Attributing this natural, if wrenching transition to anything but market forces is wishful thinking, pure and simple—it may make you feel better (“I wish I could blame President Obama for this, too!”), but it won’t alter the outcome—efficient and unemotional, market forces aren’t driven by hype or political pabulum.
–Dennis Wamsted
EXPLANATORY NOTES ON MY DATA:
- The electric generation data was all drawn from EIA’s Form 923, which the agency publishes at http://www.eia.gov/electricity/data/eia923/index.html.
- The detailed information on the 2015 retirements was collected from EIA’s Form 860, which can be found at http://www.eia.gov/electricity/data/eia860m/.
- The list of retired plants was pulled from sheet three of EIA’s Form 860 spreadsheet, sorted for coal and then saved as my own file.
- Generation data for 2011-2015 was then added to the retired coal plant spreadsheet. Potential generation was calculated using EIA’s summer capacity number*24*365. So the first plant on my spreadsheet, Illinois Power’s 95 MW E D Edwards facility, could generate 832,200.0 megawatt-hours if operated at 100 percent capacity (95MW*24*365=832,200 mwh).
- My spreadsheet differs from EIA’s numbers in a couple of respects.
- The first and most important is that EIA’s list of 2015 retired plants does not include AEP’s two-unit Kanawha River facility. Instead, the two 200 MW units are listed in EIA’s operating plants spreadsheet. The plants were closed at the end of May, 2015 and I have included them in my list of retired plants.
- The second is that I have excluded 11 small industrial coal-burning cogeneration facilities with a total capacity of 57.1 MW.
- Finally, EIA lists Louisville Gas & Electric’s Cane Run 6 unit at 240 MW; LG&E lists it at 272 MW. I have used the 272 MW figure.
- The full spreadsheet is available below, have fun. [embeddoc url=”http://www.wamstedonenergy.com/wp-content/uploads/2016/03/EIACapacityFactorData-DJW-2.xlsx” viewer=”microsoft”]
 Follow
Dennis, thanks for looking at this topic and providing this post. I’ve wanted to do something similar myself for a while and have not found the time. As you note, while the EIA data on individual plants is great, the amount of it and the way it is structured requires a lot of work to get meaningful results, like those here. The characteristics of the retiring coal fleet are generally unappreciated but critical to the future of the electricity system.
Two points I would add – although many of these units were used less often they were likely the marginal unit in many instances. Moving forward, this means that power prices could be lower due to their retirement. However, utilization at these units was generally closely related to natural gas prices – meaning that they were used to help balance the natural gas market. Looking forward, this may lead to increased natural gas price volatility as these units are not available to substitute for natural gas when prices are high.
Second, there is a significant number of coal-fired power plants that are switching to natural gas. I have not looked at the numbers recently (and I’m not sure how they would be reflected in your analysis) but it is somewhere around 12-16 GW of capacity switching between 2014-2017. Considering that these units have higher heat rates than CCS, they have higher dispatch costs, higher CO2 emissions, higher associated methane leakage, and are likely to often set clearing prices in wholesale markets. Just as understanding recent coal retirements, understanding these conversions is critical to electricity market analysis
I’m actually shocked that so many 1950s and 1960s vintage coal plants are still operating.