Category Archives: Wind

NextEra’s Robo Is Wrong About Offshore Wind

“Terrible energy policy.” That was James Robo’s dismissive comment regarding offshore wind development in NextEra Energy’s first quarter earning’s call last week. His comment was preceded by a recollection that he, and the company, had “worked very hard at offshore wind 15 years ago…on a project off of Long Island.” Ultimately, however, the company didn’t get the project—talk about holding a grudge. More to the point, is Robo really relying on a 15-year-old experience to drive corporate policy? It would be an understatement to say that much has changed in the energy business, particularly concerning renewables, during this period. To see just how much has changed, let’s narrow the scope to the last four years. And to make it particularly relevant, let’s look at the changes at NextEra subsidiary Florida Power & Light, one of the nation’s largest utilities.

In its 2014 Ten-Year Site Plan (which can be found here), FPL told Florida regulators that it had two operating solar photovoltaic facilities, totaling just 35 MW. It also said that it was in the process of “identifying other potential sites in the state for potential central station PV facilities.” But later, in its forecast of future generation, it projected that in 2023, the final year of the forecast, the utility would produce 67 gigawatt-hours of electricity from PV sources—one GWh less than the 2013 total. In other words, FPL had absolutely no intention of pursuing PV generation.

Continue reading NextEra’s Robo Is Wrong About Offshore Wind

EIA Is Damaging
 Its Analytical Reputation
 With Coal Forecasts

The pro-coal sentiments of the Trump administration are well known; unfortunately, that boosterism clearly is beginning to seep into the analytical work of the Energy Information Administration. In a late March Today in Energy piece on the EIA website, the organization reprinted three logic-defying graphics on coal’s future role in the U.S. electric generation sector (the three were originally published in EIA’s 2018 Annual Energy Outlook released in February).

The first, as EIA wrote, shows that there will be “virtually no [coal plant] retirements from 2030 through 2050.” Given the 50 gigawatts of capacity that have been shuttered just since 2011, and the 65 GW of additional capacity the administration expects will shut down through 2030, projections of zero further closures beyond that strain the bounds of believability. There is increasing support throughout the business community for a low-carbon future,  and growing numbers of utilities are coming forward with coal phase-out plans (see my earlier stories here and here). The trend is not to maintain that generation capacity, but to close it.

That flat-line projection also overlooks a key point about the age of the U.S. coal-fired generating fleet—a point that EIA itself made last year. The coal generation units in the United States are aging: According to EIA data, 88 percent of the nation’s coal capacity was built before 1990, meaning that in 2050 even the youngest plants would be 60 years old. More telling, EIA said, the coal generation fleet’s capacity-weighted age in 2017 was 39 years. Given that, projecting that there will be no retirements after 2030 simply borders on the ridiculous.

Compounding matters, EIA also projected in a leap of counter-intuititve logic, that as the coal fleet ages, its average capacity factor will climb back roughly to 70 percent—a level not seen since the mid-2000s when the plants were much younger (see the graphic below)—and then maintain that performance all the way through the end of the of its 2050 forecast period. There are two major problems with this projection. First, it ignores age-related deterioration that affects all older plants. Second, it doesn’t take into account the operational changes that have taken place in the utility sector in the past 10 years, notably the surge of new renewable generation resources that have no fuel costs and the shale boom that has pushed natural gas prices down and promises to keep them low for the foreseeable future.

The next graphic (which was taken from an April 2016 Today in Energy article) illustrates the operational changes that EIA’s current projection fails to incorporate. In 2005, coal plants by and large were operated as baseload facilities, running essentially 24/7 all year. Reflecting this, roughly 270 plants that year posted capacity factors of 70 percent or higher. By 2015, this had all changed and fewer than 100 plants recorded capacity factors that high. The system simply doesn’t operate in the same fashion as it did 10 years. Here, the surge of wind generation in the Midwest is a great example. The region’s wind resource tends to blow hardest in the overnight hours and since it has no fuel cost it is dispatched first, ahead of the coal plants that formerly would have provided that electricity.

It is also important to note that in 2005 when the coal fleet’s capacity factor was 67 percent (There is a discrepancy between the data in the two EIA graphics, but it doesn’t impact this analysis.), there were only approximately 100 units operating at less than a 40 percent level. By 2015, the number of plants at that level had climbed to almost 200.  Overcoming that drag on the overall fleet’s performance would be difficult, at best.

In short,  getting the system as a whole up to a 70 percent capacity factor is nothing more than a pipe dream. Conveniently, however, these truth-stretching assumptions allow EIA to, you guessed it, project that U.S. coal production will remain essentially flat, at roughly 750 million tons annually, all the way out to 2050 (see graphic below).

Unfortunately, wishing something so doesn’t make it so. Anyone looking for real analysis of what is going on in the coal industry is going to have to start looking elsewhere.

–Dennis Wamsted


Trump’s Coal Revival Nothing More Than Talk According to EIA Data

More facts showed up this week telling the same story about coal—the revival isn’t coming.

These new facts (see here for an earlier post about ‘stubborn facts’), courtesy again of the independent Energy Information Administration, show that coal production in the United States totaled 773 million short tons in 2017. This was up 6 percent from 2016, but better keep the champagne corked. The increase was due entirely to exports, a volatile market that is not conducive to long-term growth. To wit, in the five years from 2012-2016, exports swung from a high of 125.7 million short tons to a low of 60.3 million short tons.

In the vastly more important domestic market, particularly the electric power sector, which accounts for 85-90 percent of overall annual coal consumption, demand dropped, falling by a little more than 12 million tons in 2017. And those tons are never coming back: EIA’s latest Short-Term Energy Outlook (available here), its first to include projections through 2019, projects that electric power demand for coal will continue falling, dropping to 629.5 million tons that year, down from 666.4 million tons in 2017.

Continue reading Trump’s Coal Revival Nothing More Than Talk According to EIA Data

The Facts Tell The Story: Coal Comeback Is Nothing But A Trump Delusion

“Facts are stubborn things.”

John Adams, our second president, generally gets credit for this wonderful aphorism, but regardless of who was the first to say it, the observation itself is what matters: You simply cannot wish away facts. This came to mind earlier this week when I looked at the Energy Information Administration’s monthly electric power overview (which can be found here); it’s a publication that only the geekiest of energy wonks would ever read, particularly on a regular basis. However, dry as it may be, it does one thing exceedingly well: It presents facts, just as they are—not as people may want them to be.

One of the many such facts that caught my eye this month concerns electricity generation from coal, that shiny black rock that seems to be the moving force behind all the Trump administration’s energy and environmental policies. ‘The war on coal is over,’ his minions mouth repeatedly. ‘We are going to bring the jobs back,’ the president assures miners at every opportunity.

Problem is, facts are stubborn things. In the EIA review, which covers the first nine months of 2017, coal-fired electricity generation fell compared to the comparable year-earlier period. To be fair, it didn’t drop by much, sliding 1.5 percent to 919,805 thousand megawatt-hours from 934,267 thousand mwh a year ago. However, if the war is over and the jobs are coming back, then there should have been no slide at all; indeed, there should have been an increase.

The slide in coal-fired generation also pushed coal production for the sector, which accounts for the vast majority of U.S. coal consumption, down during the first nine months. Overall, just over 504 million tons of coal were used to generate electricity, down from 509 million in 2016—which was the lowest production year for the industry since 1979. Hardly the turnaround the Trump administration repeatedly trumpets.

What the administration definitely doesn’t trumpet in its incessant tweets and coal-dominated decision-making, is that during this same nine-month period, generation from non-emitting wind and solar jumped 13.6 percent, climbing to 284,584 mwh from 250,482 mwh in 2016. Combined with hydro, renewables generated just over 525,000 mwh of electricity annually for the first nine months of the year, within hailing distance of the nation’s nuclear sector, which has generated just under 600,000 mwh so far this year.

And while the administration clearly is not a fan of renewables, more growth in this sector is just around the corner. The American Wind Energy Association says 84,000 MW of wind capacity are installed across the United States, with another 25,000 MW under construction. Similarly, the Solar Energy Industries Association reports that 47,000 MW of solar capacity has been installed in the U.S., with another 21,000 MW of utility-scale solar generation currently in the construction pipeline.

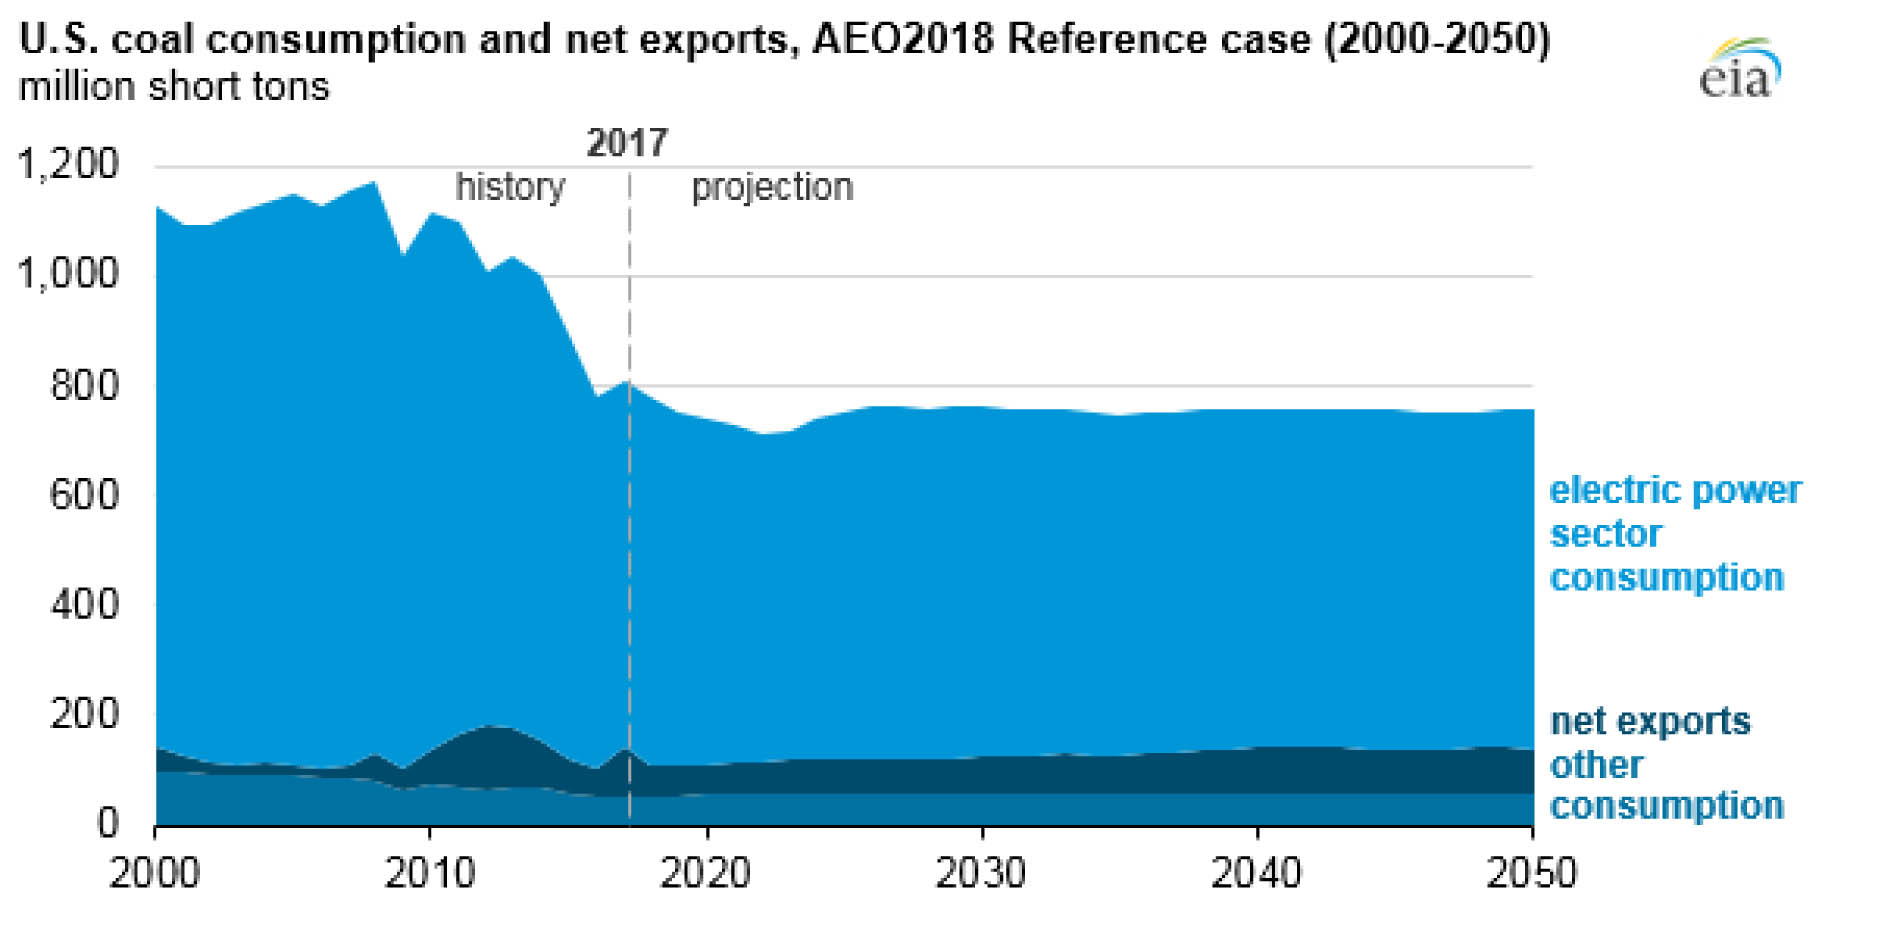
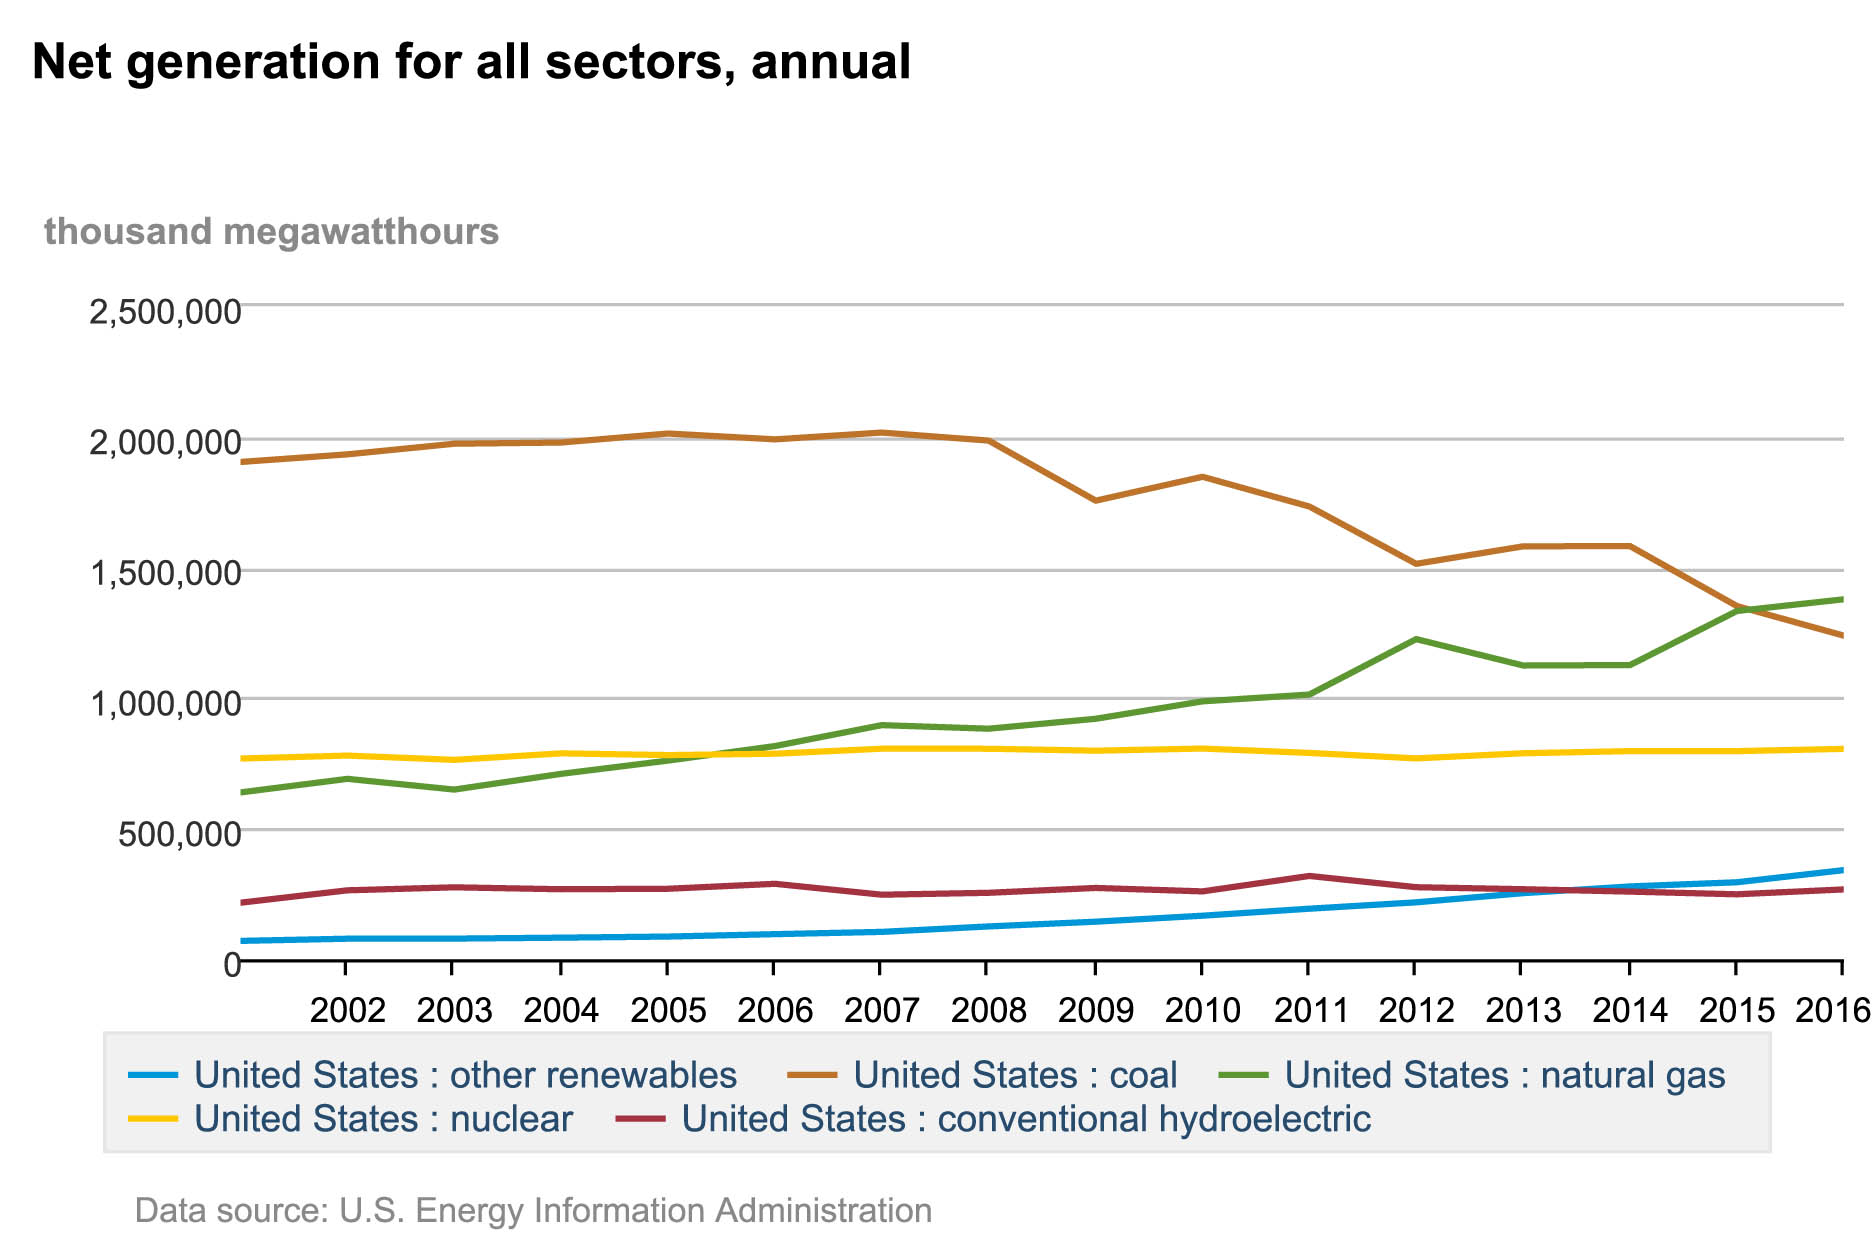
As much as Trump and his backers like to blame renewables and the environmental community for the downfall of coal, the stubborn little fact is that the war, such as it was, against coal was waged, and won, by natural gas. From an expensive afterthought used largely just as a peaking resource during periods of high demand in the early 2000s, natural gas has taken ever-larger chunks of the electric generation market since then. From less than 20 percent of the total in 2001 (when coal’s share was roughly 50 percent), natural gas’ share of the market has climbed steadily, reaching 34 percent in 2016 and topping coal as the largest single source of electricity in the United States (see graphic below).

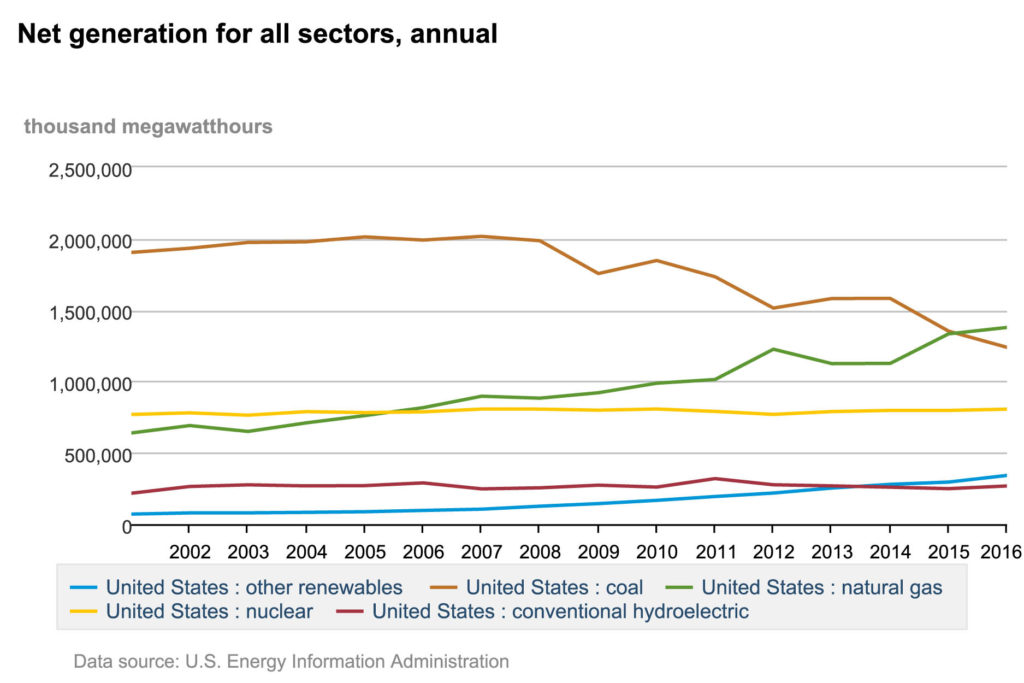
This transition, in turn, was due to another simple, stubborn fact: Huge quantities of formerly uneconomic gas supplies in the Mid-Atlantic and surrounding regions became accessible at affordable prices due to the commercialization of horizontal drilling and fracking technologies. As EIA noted earlier this year in one of its Today in Energy news stories (available here): “The increase in natural gas generation since 2005 is primarily a result of the continued cost-competitiveness of natural gas relative to coal.”

No war, no hidden agendas, just stubborn economic facts—obvious for anyone to see, provided, that is, they are willing to look.

–Dennis Wamsted


Latest DOE LED Report
 Illustrates Transition
 In Electric Power Sector

I was at Home Depot this weekend (so many tools, so little time) and they had a special on LED lights that caught my attention—a four pack of dimmable 60-watt replacement LEDs was selling for $9.88, or just under $2.50 a bulb. I’m not the type to track day-to-day pricing for much of anything, but the display caught my attention because I had just finished reading the Energy Department’s latest report on the status of the LED market—which found that the typical dimmable 60W replacement bulb in 2016 cost roughly $8 apiece.

This is important for two reasons. First, DOE assumes that LEDs are steadily going to account for an ever-larger percentage of the installed lighting stock in the United States, estimating that by 2035 86 percent of all the lighting in the country will be LEDs of one type or another and that these vastly more efficient lights will cut primary energy use by 3.7 quadrillion British thermal units (Btus)—that’s a lot of electricity that will no longer be needed, about 10 percent from the 2016 level, in fact, when roughly 37.5 quads were used to generate electricity in the U.S. (Paying attention out there in utility land?) But those DOE forecasts rely heavily on pricing assumptions, and if the current price of the most commonly used LED has already tumbled below $2.50, down roughly 70 percent from just a year ago, that means the nationwide take-up of LEDs almost certainly will be faster than DOE currently estimates.

Second, the sharply declining price of this lowly light bulb is a symbol of the massive changes under way in the energy industry, such as the steep declines in solar and windpower costs, the surge in corporate interest in cleaner energy and the plateauing of electricity demand. These changes are largely market-driven and, thankfully from my perspective, outside the reach of politicians on either side of the aisle.

Continue reading Latest DOE LED Report
 Illustrates Transition
 In Electric Power Sector